Intent Data
Target, engage, and convert with intent
Multiple intent sources combine to capture buying behavior where it happens – giving you the power to take action.
Capture and layer intent signals from diverse buying channels
Identify intent across your website, the public web, industry content, and Foundry’s opted-in audience to provide a more meaningful view of in-market buyer behavior.
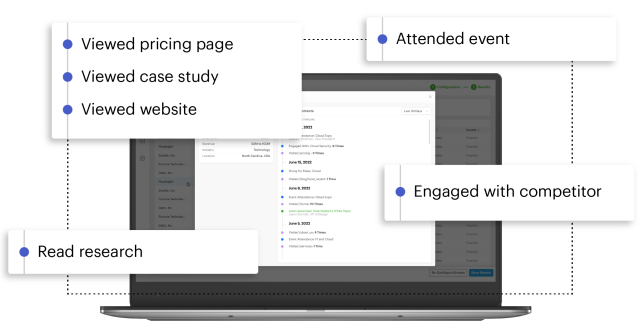
Intent signals where they happen
Identify and monitor buying behavior from active accounts on your website
Engagement with our digital content, content syndication programs, and events
Conversational signals across social, blogs, job boards, and beyond for 5+ million companies
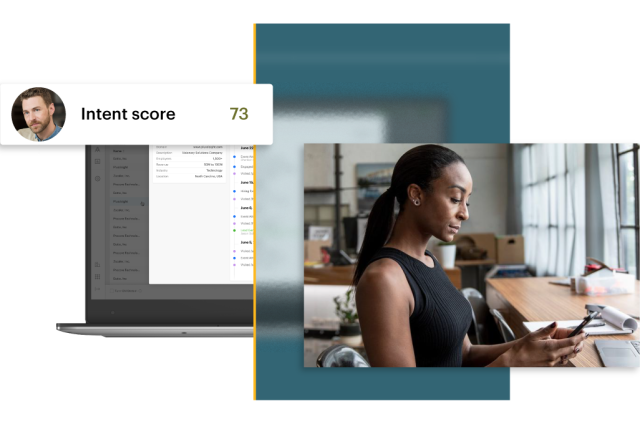
A look at our intent data
Intent signals captured per week
Audience members means you can confidently reach buyers at scale
Targeting dimensions — including intent, persona, and firmographic points — ensure your reach has relevance
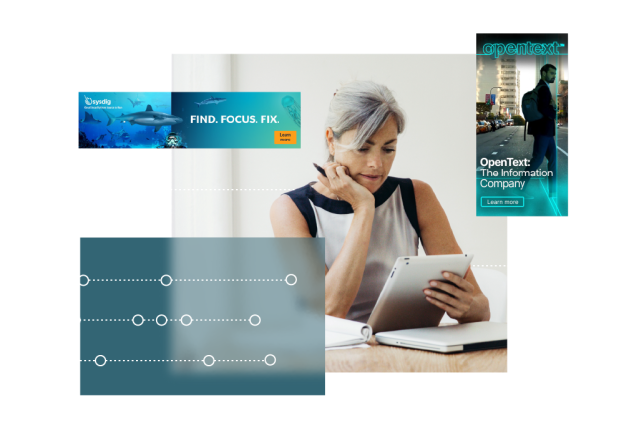
Take immediate action on in-market buyers
Activate Foundry intent data with intent-driven campaigns and tools designed to amplify the impact of intent and drive revenue hands-free.
Reach your most relevant audiences across their buying journeys with Foundry Ads programs. Tailor and optimize your advertising efforts, so every marketing dollar goes further.
Demand gen programs from Foundry target decision makers from your ABM list demonstrating relevant purchase intent signals. Generate leads backed by proven digital engagement with your content that drive greater pipeline conversion.
Empower sales and marketing and align teams with insight into what their buyers care about.
Research
Intent targeting increases campaign efficiency by 2.5x
Peer-reviewed research from Foundry examines the impact of intent targeting in advertising and demonstrates how marketers can achieve stronger results with greater efficiency. Learn more about our findings in this blog.
Integrate with intent
Connect to the critical platforms your team uses everyday to segment and activate based on dynamic buying behavior.
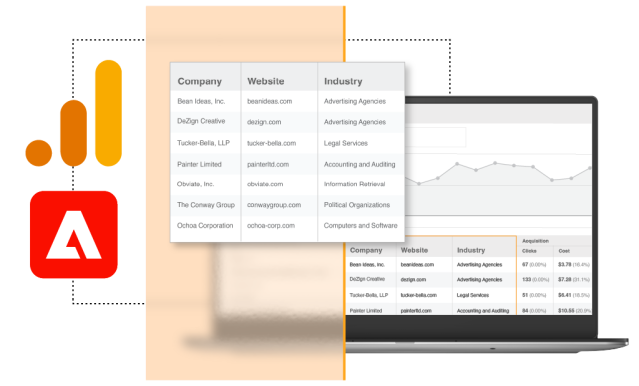
Discover the companies visiting your website
Identify high-value website visitors and monitor buying behavior in your analytics platform.
Try IntentBot
See accounts showing intent in real time
Enter a domain and topic for a list of accounts showing intent. Try to prioritize and reach these in-market accounts this week.
| Company | Size | Location | Industry |
|---|
| Company |
|---|
| Size |
| Location |
| Industry |
Get my report
See insights on the types of companies showing intent and up to 100 in-market accounts based on your inputs.
Want to reach the buying committee within these accounts?
Book a demo to get intent at the contact level.
Trusted by brands around the world
We help our customers succeed
Read our G2 reviews to see why Foundry Intent is consistently named a market leader in Buyer Intent Data Providers.
Resources
Much of the buyer’s journey happens behind closed doors. We’ll show you how to identify in-market buying behavior and leverage it to ensure you stay top-of-mind.
Intent data can be a little intimidating. Learn how to implement intent data and use it to create effective account-based marketing campaigns.
As ABM adoption spreads, discover how marketers use intent data to fuel their ABM programs and the success and challenges with ABM and intent.
Just getting started with intent data? Here’s everything you need to know about the various forms of intent, how it’s collected, and how sales and marketing teams use it.
Frequently asked questions
-
How do we collect intent?
Our intent data is collected from your website, social media interactions, engagements across the public web, research signals on global content, and Foundry’s proprietary audiences from our publishing network, events data, and branded conversations with real people.
-
I already use intent data. How is this different?
We’re looking at intent differently, because buying doesn’t happen in one place. Most other vendors are only showing you intent signals from one place, like reading content. Foundry Intent is looking for buying signals on your website, the public web, our owned networks, and beyond for a more comprehensive view of who’s in-market and how. Then, we match intent signals with buyers and buying committees showing propensity to buy and send it your way, with their associated activity for immediate and personalized activation.
-
What’s the pricing for Foundry intent-driven programs?
Pricing and packaging is dependent on data volume and use case. Contact us to learn more.
-
I’m already a Foundry customer, how can Foundry Intent help?
We’re here to help you scale revenue faster. Convert intent data with advertising, lead generation, ABM, and more from Foundry. If you want to learn more, email your account manager.